Newsletter, guides
Langfuse and Grafana: LLM monitoring dashboards
Put Langfuse LLM metrics in Grafana with the Metrics API and dashboard JSON, next to Prometheus panels, alerts and trace links. Checked against Langfuse v4.
You wired Langfuse into your agent and can debug any single trace. You also added Prometheus histograms for request rate and latency. When a user complains at 2pm, you open Grafana for the latency trend, then Langfuse for the trace, then Grafana again. The context never fits on one screen.
A Langfuse and Grafana setup is an LLM monitoring stack that shows Langfuse metrics next to Prometheus metrics, by reading the Langfuse Metrics API from a Grafana data source. This guide covers the data source, the dashboard JSON, the alert rules and the links. Those links take on-call from a Grafana spike to the Langfuse trace.
Key takeaways
- Langfuse is an LLM tracing and evaluation tool, and Grafana is a dashboard and alerting tool. Most production agent teams run both and link them.
- Since Langfuse v3, traces, observations and scores live in ClickHouse, not Postgres. A Grafana Postgres data source pointed at Langfuse finds no trace data.
- The supported way to get Langfuse numbers into Grafana is the Langfuse Metrics API, read with the Grafana Infinity data source using its backend parser.
- Langfuse custom dashboards export and import as JSON, so a team can version the in-Langfuse view in git next to the Grafana dashboard JSON.
- Alert on outcomes: error rate, p95 latency, cost per hour and silent traffic drops. Put a Langfuse link in every alert so on-call lands on the traces.
Langfuse vs Grafana: which one do you need?
You need both, because each answers a different question. Langfuse answers “what did the model see and do on this request?” Grafana answers “is anything trending badly, and who gets paged?”
Langfuse captures prompts, completions, tool calls, token counts, model names, costs and eval scores per trace. It ships its own dashboards for latency, cost and usage. Grafana reads many data sources, Prometheus first, and owns alert routing and on-call. Prometheus holds the numeric time series your service emits: request rate, error rate and latency histograms.
Three failure modes show up when a team picks one:
- Prometheus only: you see p95 latency spike but cannot tell which prompt, model or tool caused it.
- Langfuse only: you see bad traces one by one, but your pager and service dashboards live in Grafana.
- Both, unlinked: you have both tools open in separate tabs and match timestamps by hand on every incident.
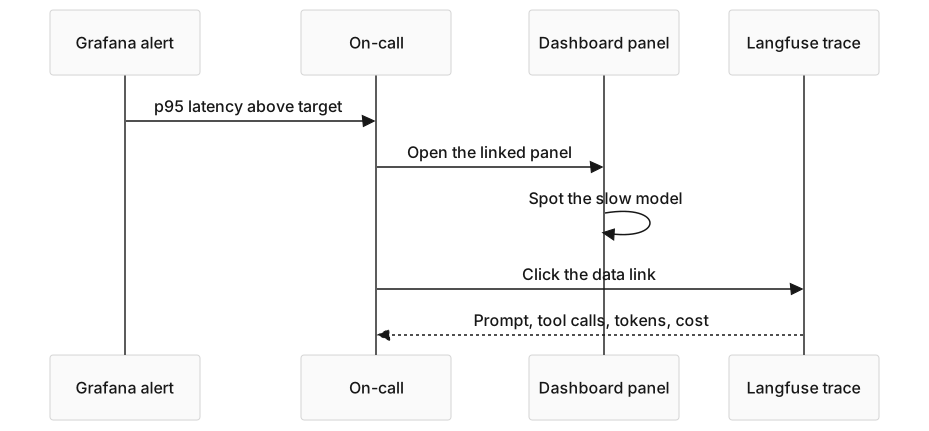
The fix is one Grafana dashboard with Prometheus panels, Langfuse panels and links into Langfuse traces.

Can Grafana query the Langfuse database directly?
Not the way older guides describe. Since Langfuse v3, the self-hosted architecture keeps transactional data in Postgres and stores traces, observations and scores in ClickHouse. A Grafana Postgres data source on the Langfuse database sees users, projects and prompts, but no traces.
Self-hosted teams can point Grafana’s ClickHouse plugin at the Langfuse ClickHouse. Treat that as an internal schema. Langfuse v4 changed the data model so that traces and observations are no longer separate entities, and direct SQL written for v3 breaks on such changes. The Metrics API is the stable contract, so build on it.
How do you add Langfuse as a Grafana data source?
Install the Grafana Infinity data source and point it at the Langfuse public API. Infinity reads JSON from any REST endpoint and supports basic auth, which is what Langfuse uses.
- Install the plugin:
grafana cli plugins install yesoreyeram-infinity-datasource, or add it from the Grafana plugin catalog. - Create an Infinity data source. Set the auth method to Basic. The username is your Langfuse public key and the password is your secret key.
- Add your Langfuse host, such as
https://cloud.langfuse.com, to the allowed hosts list. - Use the backend parser in every query. Grafana alerting only works on Infinity queries that use a backend parser (JSONata or JQ).
Create a dedicated Langfuse API key pair for Grafana. You can rotate or revoke it without touching the keys your agent uses to send traces.
How do you query the Langfuse Metrics API?
Send GET /api/public/v2/metrics with a JSON query parameter. The query names a view, the measures and aggregations, optional dimensions and filters, a time range and an optional time bucket.
This query returns p95 latency of root observations per model, bucketed by time. Root observations stand in for whole traces in v4.
{
  "view": "observations",
  "metrics": [{ "measure": "latency", "aggregation": "p95" }],
  "dimensions": [{ "field": "providedModelName" }],
  "filters": [
    { "column": "isRootObservation", "operator": "=", "value": true, "type": "boolean" },
    { "column": "environment", "operator": "=", "value": "production", "type": "string" }
  ],
  "timeDimension": { "granularity": "auto" },
  "fromTimestamp": "${__from:date:iso}",
  "toTimestamp": "${__to:date:iso}"
}
${__from:date:iso} and ${__to:date:iso} are Grafana built-in variables. Grafana fills them with the dashboard time range in ISO 8601, which is the format the API expects. Each row in the response’s data array carries the dimension, a time_dimension field and the metric under the alias {aggregation}_{measure}, here p95_latency.
Useful measures on the observations view include count, latency, timeToFirstToken, inputTokens, outputTokens, totalCost and countScores. Aggregations run from sum, avg, min and max to p50 through p99. High-cardinality fields such as traceId, userId and sessionId work only as filters, not as grouping dimensions.
Version check: v2 runs on Langfuse Cloud and on self-hosted Langfuse v4 or later. Self-hosted v3 has only the v1 endpoint, GET /api/public/metrics. Langfuse Cloud serves v1 until 16 November 2026.
What does the Grafana dashboard JSON look like?
Each Langfuse panel is an Infinity target with the URL, the query parameter, a root selector of data and typed columns. Paste this into a panel’s JSON model, then change the data source uid to yours.
{
  "type": "timeseries",
  "title": "Langfuse p95 trace latency by model (ms)",
  "datasource": { "type": "yesoreyeram-infinity-datasource", "uid": "langfuse" },
  "targets": [
    {
      "refId": "A",
      "type": "json",
      "source": "url",
      "parser": "backend",
      "format": "timeseries",
      "url": "https://cloud.langfuse.com/api/public/v2/metrics",
      "url_options": {
        "method": "GET",
        "params": [
          {
            "key": "query",
            "value": "{\"view\":\"observations\",\"metrics\":[{\"measure\":\"latency\",\"aggregation\":\"p95\"}],\"dimensions\":[{\"field\":\"providedModelName\"}],\"filters\":[{\"column\":\"isRootObservation\",\"operator\":\"=\",\"value\":true,\"type\":\"boolean\"}],\"timeDimension\":{\"granularity\":\"auto\"},\"fromTimestamp\":\"${__from:date:iso}\",\"toTimestamp\":\"${__to:date:iso}\"}"
          }
        ]
      },
      "root_selector": "data",
      "columns": [
        { "selector": "time_dimension", "text": "time", "type": "timestamp" },
        { "selector": "providedModelName", "text": "model", "type": "string" },
        { "selector": "p95_latency", "text": "p95 latency ms", "type": "number" }
      ]
    }
  ]
}
For cost, swap the metric for {"measure": "totalCost", "aggregation": "sum"} and the column selector for sum_totalCost. For eval quality, use the scores-numeric view with {"measure": "value", "aggregation": "avg"} grouped by name. Run one raw request with curl first and check the column names and timestamp format against your Langfuse version.
The Prometheus side is plain PromQL. The error rate panel below uses the request counter from the FastAPI Prometheus metrics guide:
sum by (handler) (rate(http_requests_total{status="5xx"}[5m]))
/
sum by (handler) (rate(http_requests_total[5m]))
What panels should an LLM monitoring dashboard have?
Six panels answer the questions on-call asks first:
- Request rate and error rate (Prometheus, time series).
- p50 and p95 request latency (Prometheus, time series from the latency histogram).
- p95 trace latency by model (Langfuse, the JSON above).
- Cost per hour by model (Langfuse,
sumoftotalCostwith anhourtime bucket). - Eval score average by score name (Langfuse,
scores-numericview). - Cost and latency by prompt version (Langfuse, grouped by
promptNameandpromptVersion).
The last panel answers a common question: how do I compare two prompt versions in Grafana? Langfuse prompt management tags each generation with the prompt name and version. Grouping by both puts an A/B comparison next to your service metrics.
Langfuse also has its own custom dashboards, with curated ones for latency, cost and usage. Widgets and whole dashboards download as versioned JSON and import by dragging the file onto a dashboard. Keep that JSON in git next to the Grafana dashboard JSON, so both views are reviewed and restored the same way.
How do you jump from a Grafana panel to a Langfuse trace?
Add a data link to the panel. A data link is a URL template that Grafana fills from the clicked point or row. Langfuse trace URLs follow the pattern https://cloud.langfuse.com/project/<projectId>/traces/<traceId>.
The Metrics API cannot group by trace ID, so metric panels link to the project’s traces view instead. When a table row does carry a trace ID, for example a Loki log line where your app logs the Langfuse trace ID, link straight to the trace:
https://cloud.langfuse.com/project/<projectId>/traces/${__data.fields["trace_id"]}
In the Python SDK, get_client().get_trace_url() builds the same URL for the current trace. Log it with every error so the link is one click from any log line.
What alert rules do you set?
Alert on outcomes users feel, and route each alert with a Langfuse link in its annotation. The thresholds below are examples. Set yours from two weeks of baseline data.
- Latency spike (Prometheus): p95 above your latency target for 10 minutes. Page on-call.
- Error rate (Prometheus): 5xx share above an example threshold of 2 percent for 5 minutes. Page on-call.
- Cost spike (Langfuse through Infinity, backend parser): cost per hour above twice the same hour yesterday. Send to Slack.
- Silent failure (Prometheus): request rate at zero for 10 minutes. This catches a service that accepts no traffic at all.
Keep paging alerts on Prometheus metrics your service emits itself. Then a Langfuse outage or an expired API key cannot silence your pager. Use Langfuse-sourced alerts for cost and quality trends.
What to do next
- Create a Langfuse API key pair for Grafana and add an Infinity data source with basic auth and the backend parser.
- Run the p95 latency query with curl, check the response fields, then paste the panel JSON into a new dashboard.
- Add the Prometheus panels for request rate, error rate and latency next to the Langfuse panels.
- Add data links from each Langfuse panel to your project’s traces view, and log the trace URL on every error.
- Set the four alert rules, with a Langfuse link in each annotation.
- Export the dashboard JSON and your Langfuse dashboard JSON into git. Then build the Langfuse agent dashboard lab end to end.
Frequently asked questions
Is Langfuse a better AI observability platform than Grafana?
They do different jobs, so most teams run both. Langfuse is built for LLM traces: prompts, completions, tool calls, token usage, costs, prompt versions and eval scores. Grafana is built for dashboards and alerting across many data sources, with Prometheus metrics and on-call routing. Use Langfuse to debug a single request and Grafana to see trends and page people.
How does Grafana compare to Langfuse for tracing LLM applications?
Langfuse understands LLM spans out of the box. It shows the prompt, the completion, the model, token counts and cost for each generation, and links them into one trace. Grafana can show traces through a backend such as Tempo, but it has no prompt management or eval scores. For LLM tracing, Langfuse gives you more with less setup.
Where do I find Langfuse LLM monitoring dashboards as JSON?
Langfuse custom dashboards and widgets export as versioned JSON from their menu, and import by dragging the file onto a dashboard. For Grafana, build each panel as an Infinity query against the Langfuse Metrics API, then export the Grafana dashboard JSON. The panel JSON in this guide is a starting point for latency, cost and eval panels.
Does Langfuse have a Prometheus exporter?
The Langfuse docs do not describe a Prometheus exporter for trace metrics. Two patterns work instead. Read the Langfuse Metrics API from Grafana with the Infinity data source. Or emit your own Prometheus counters and histograms from the agent service, next to the Langfuse SDK calls, so latency and error alerts never depend on Langfuse.
Can I A/B test prompts and see the results in Grafana?
Yes, if you use Langfuse prompt management. Each generation records the prompt name and version. A Metrics API query grouped by promptName and promptVersion returns cost, latency and token counts per version. Add a scores-numeric query for eval scores per version, and chart both in Grafana.
Sources
- Metrics API, Langfuse, October 2026: the v2 endpoint, query shape, views, aliases and the self-hosted version split.
- Deprecated API migration, Langfuse, October 2026: the v1 metrics end date on Cloud and the v4 data model change.
- Self-hosting Langfuse, Langfuse, October 2026: Postgres for transactional data and ClickHouse for traces, observations and scores.
- Custom dashboards, Langfuse, October 2026: curated dashboards and JSON export and import of widgets and dashboards.
- Infinity data source, Grafana Labs, October 2026: JSON APIs, basic auth, and alerting only with a backend parser.